Performance Optimization refactor in Large Python Codebase, a note
Background
Early this year, I had a chance to take a refactor task: one of our big downstream features doesn’t scale. Here I share some of my learning notes to potentially help you out there :-).
Steps to follow
1. Runnable Minimal Reproduce
For a distributed system that required heavy hardware setup, or even worse, when you are trying to fix a case in the condition of a large scale, we need to have a runnable minimal reproduce(RMR) method to decouple the costly large scale of test environment/ production environment. A handy RMR is crucial as it brings us repeatability in circles of the rests steps.
In my case, when I started looking into this task, I found the only environment in hand was already quite expensive for the team (15+ servers, each of them is with 100+ GiB RAM and 40+ threads), yet it’s still far from the scale I am optimizing for(1000+ servers case).
How to have a RMR?
The answer could vary case by case:
- Buy/Pay-as-you-go-on-others-server 1000+ nodes cluster?
- This may be the best choice when you are in a cool organization working ;)
- Setup virtualized node cluster?
- In case you are dealing with the case you can semi-virtualize your environment to gain a 10/100 times scale yet with the closest to the real 1000+ node scale: use some efforts to set up 10 VMs on each bare-metal servers, that is, with 15+ servers you can reproduce the 150+ server issues. In my case, to create a virtualized environment is still very expensive as the workload we were working on depends on layers not that straightforward to be virtualized, and 150+ is still not enough for me.
- Mock it!
- I end up isolating the modular of code to be optimized, and, carefully mocking the interactions with other applications/ processes, with performance-wise mock.
With the RMR implemented, I put it in the existing UT code base with performance benchmark criteria as one of the assertions of the function I optimized. One of the reasons to trigger my putting RMR code in the codebase as UT is some of the surrounding mock utilities are there already, of course, the most important one is by doing so, these performance criteria will be always regression in every single commit merged to the codebase in future.
It’s worth mentioning that, during the implementation of RMR, there are some assumptions to be made, for example, the involved database, RESTful API, and RPC calls were mocked with sort of sleep in certain times, which was estimated based some experiments. The actual value may vary in different environments while values under some assumptions still can help us on some level of evaluation, yet, provide us comparison on before and after the refactoring (as of course, we use same assumptions).
2. Profiling and analysis
I started to have more of the whole-picture view of the function in two ways almost the same time: profiling and code reading.
Before profiling the function calls, I perceptually went through the code the feature and drew all call flows with time complexity with http://asciiflow.com/ like this:
Or drew it in whiteboard like this:

While we should never start making decisions on the refactoring before seeing some pieces of evidence supporting your optimization direction, there could be a hidden piece of code you were not aware of or, not executed the way you thought it should be.
In my case, to help understand more of the code and the performance overview of the call flow, I used two tools:
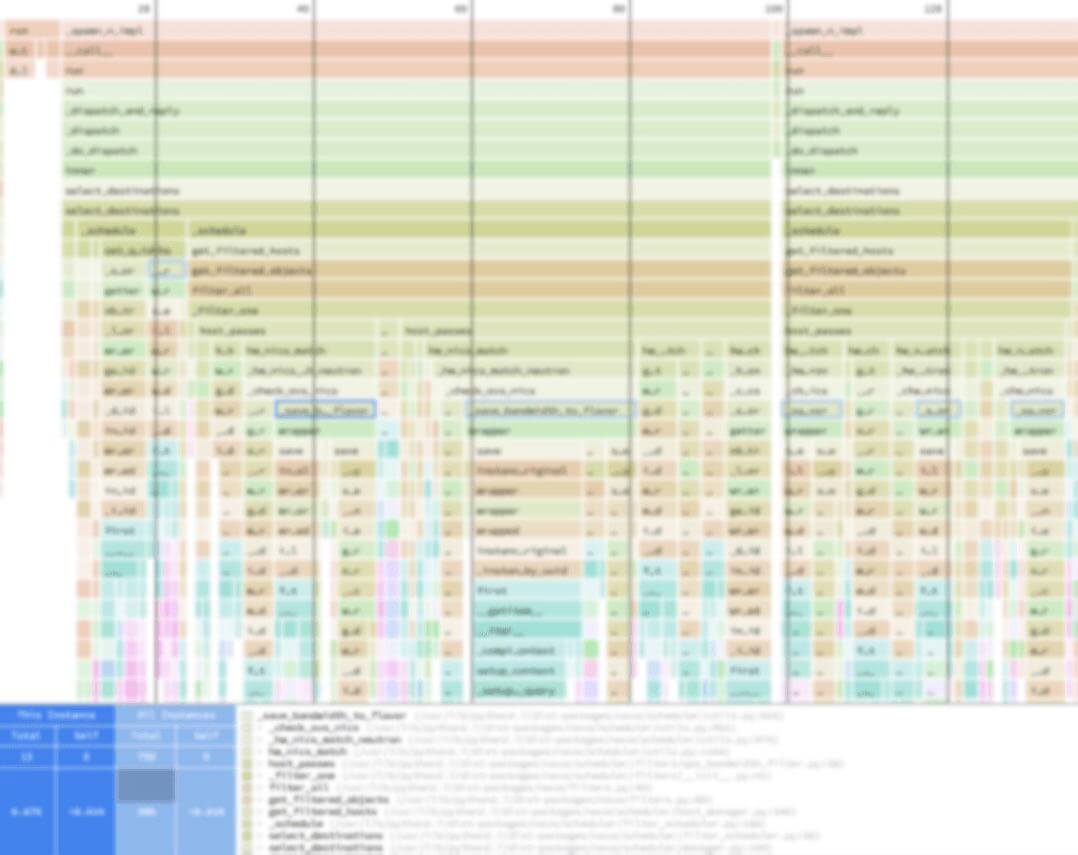
I used py-spy to attach to a running process of the real environment(the 15+ node one), and the output of py-spy can be chosen to be parsed with https://www.speedscope.app, which is something like:
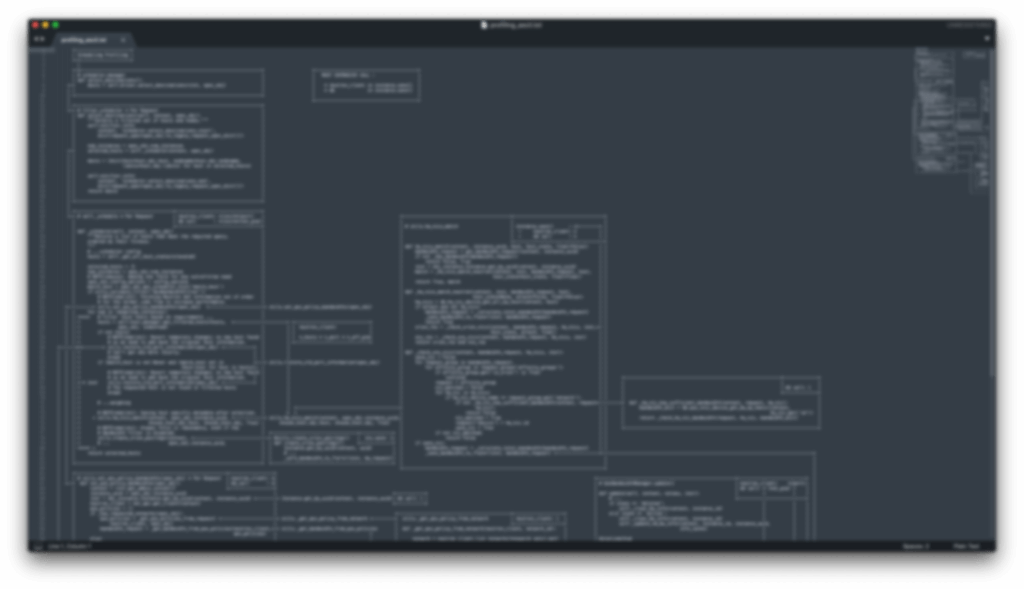
I added pycallgraph into the RMR, and created a utility script to enable profiling with results from code base with tox and UT functions, and created a result output like this, where I masked information in this example manually.
1 | =============================================================== |
With the help of the profiling output, I polished my refactoring plans, and gained more confidence to say the optimization may work. More importantly, the utility I created and the callflow chart can be rechecked/rerun anytime. It’s really to have your context persistent in a visualized fashion and again, RMR with profiling.
3. Refactor
It took much more time than I initially planned for the refactor implementation, there are always details not written in requirement/design documentation, and that involved more changes before all proposals landed eventually and brought me back the Step1 or Step2 to rework certain things. Thus I kept polishing the RMR code, the profiling code, polishing the call flow(with more details) and changed the design again and again.
With the help of RMR profiling, I could always quickly see the effect/ impact of every step changes, which, I consider make the refactor process even happier ;-).
In this project:
DB Schema was changed, this help reduce DB calls and introduce more reasonable data structures
Many functions were refactored to:
- be decoupled with functions of other features
- from a. centralized b. always calculated on the fly, to a. distributed to workers b. maintained and cached in an acceptable interval of loops
- configurable cache aging policy and state change policy(from real-time consistency to eventual consistency in different polling intervals)
4. Regression Tests, CI piped
- In the final phase, with the refactored codebase in a stable state, that is:
- All UT passed in the new design
- Confirmed profiling utility results with expected gains
We could use as much as possible the legacy end to end regression test cases to ensure the refactor brought no surprises :-). I’m willing to bet that you will have to go back to some changes and even need to return to some of the previous steps, in that case, CI piped end to end test will save your life again and again before we call the refactor a success.