Distributed bugs are often latent: a Troubleshoot Story
Abstract
OpenStack, as a nested distributed system(where some of the subsystems are distributed systems), to troubleshoot on it could be quite tricky, not to mention its interdependence with other distributed systems in real word.
We all share the feelings on how hard it is to solve a hidden issue in a distributed system as each call during a chain of invocation is unpredictable, the methods/ tools for sniffing/ tracking each part are either too hard, incapable, outside of control, or too expensive.
The trigger made me composing this blog is the article: Challenges with distributed systems from Jacob Gabrielson, where Jacob expounded how and why designing/ managing a request/response distributed system is challenging. I recommend to read it 😊.
The story in this blog is a troubleshoot case I solved in a customer staging network years ago, where OpenStack clusters were integrated with some other different (virtual) Network Function clusters.
Background
There were many OpenStack Clusters onsite, with different VNFs running on top of them.
Two months before I arrived the customer site, the alarm
[NTP Upstream Server Failure]was raised in one of the OpenStack Cluster.Every party involved on this issue had looked into it jointly and each of them claimed they are all good: no clue to move on, and after the whole site’s yearly power down and up activity, the issue was gone.
One week ago, after a control plane nodes reboot, this alarm was raised again on another OpenStack Cluster.
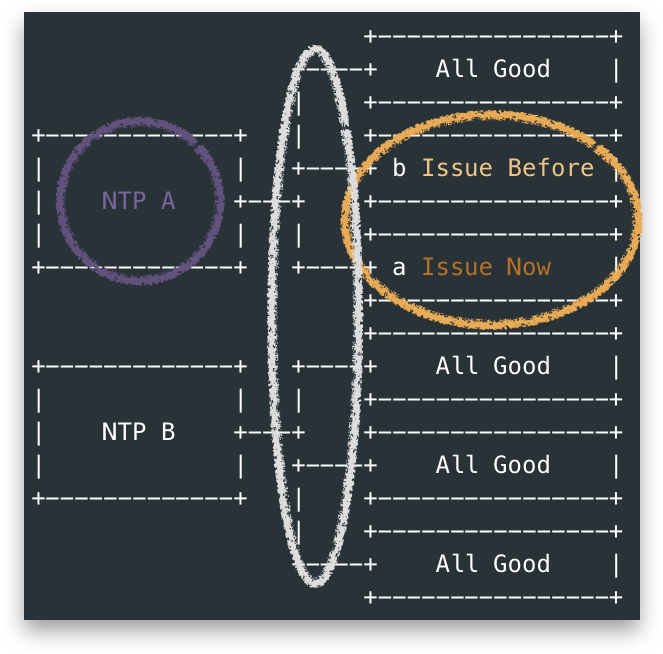
Reviewing everything to have the pattern of the issue:
There were two types of servers acted as upstream NTP for Openstack Clusters. Let’s say NTP-A and NTP-B, they were actually not dedicated NTP servers but a more heavy network function(NF):
![]()
- NTP-A was the one associated with the issue OpenStack Clusters, which was a VNF running in Linux.
- NTP-B was a native NF in Solaris, to be repalced by NTP-A in future. #Customer has reasons to worry the issue more 😜.
The OpenStack side claimed they were good because they captured the NTP client packet sent to NTP-A and no response recieved.
The other side checked everything around NTP configuration, network etc. nothing abnormal was sorted out. Thus they had to blame the OpenStack side as there were other systems utilizing their NTP-A as upstream NTP, while no issues had encounterred.
Then both side suspected the packet was dropped somehow between NTP-A and OpenStack Cluster: the networking/ switches.
- The switch team observed nothing pointing to packet drop from the traffic .
- Even though there was chance they didn’t capture the drop on right time, why only OpenStack’s NTP request not responded?
- Was this issue happening in small frequency?
Troubleshoot Story
Luckily yet unfortunately, the alarm was kept being raised from OpenStack Cluster a, let’s call it OS-a, I started to look into this issue from it.
First, allow me to explain how this OS-a call upstream NTP.
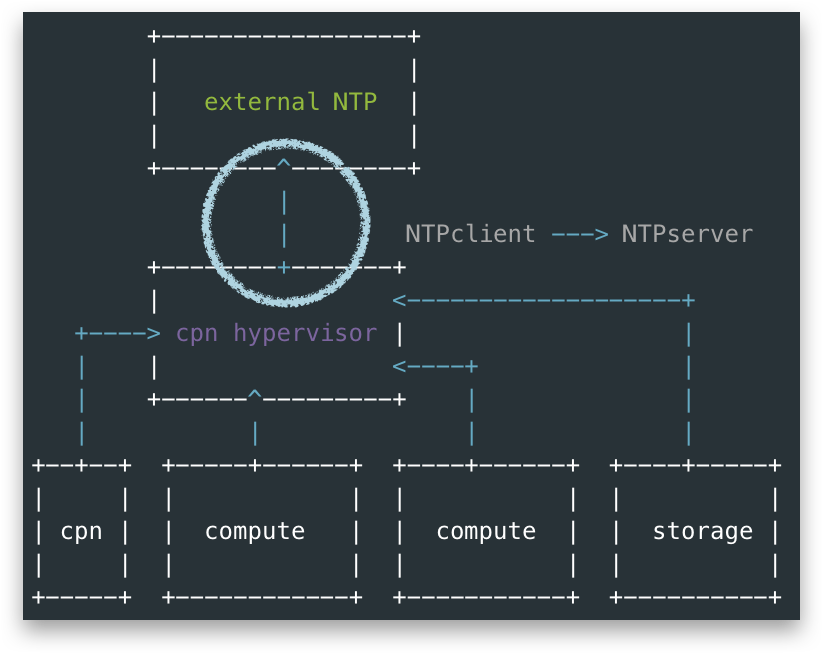
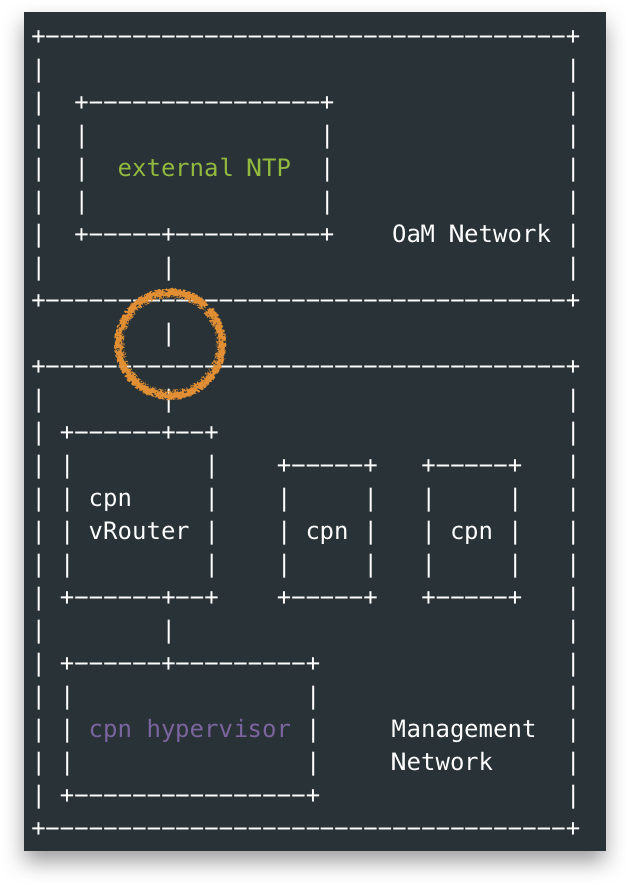
From below figure, I used blue arrow to show a NTP client to server call, we could see all nodes include control-plane node(cpn), and other nodes configured their upstream NTP server as the control-plane hypervisor. Thus the alarm actually means something is wrong around the circle in the figure.
note, in this OpenStack Cluster, the control-plane nodes were VMs hosted by cpn hypervisor node
And let’s check NTP stats from the cpn hypervisor node, from below we could tell the [NTP server side packet not being recieved] frequency was hard to say small: in last 256 * 8 seconds of the moment, 3 of 8 NTP polling hadn’t get responded packet. By checking the alarm triggerring code, it’s found only after more than 1800 seconds a upstream NTP server not responding, a alarm will be raised, which is a slightly high threhold.
note, please refer to Appendix:
ntpd -pnexplained on how we get this information from below printout.
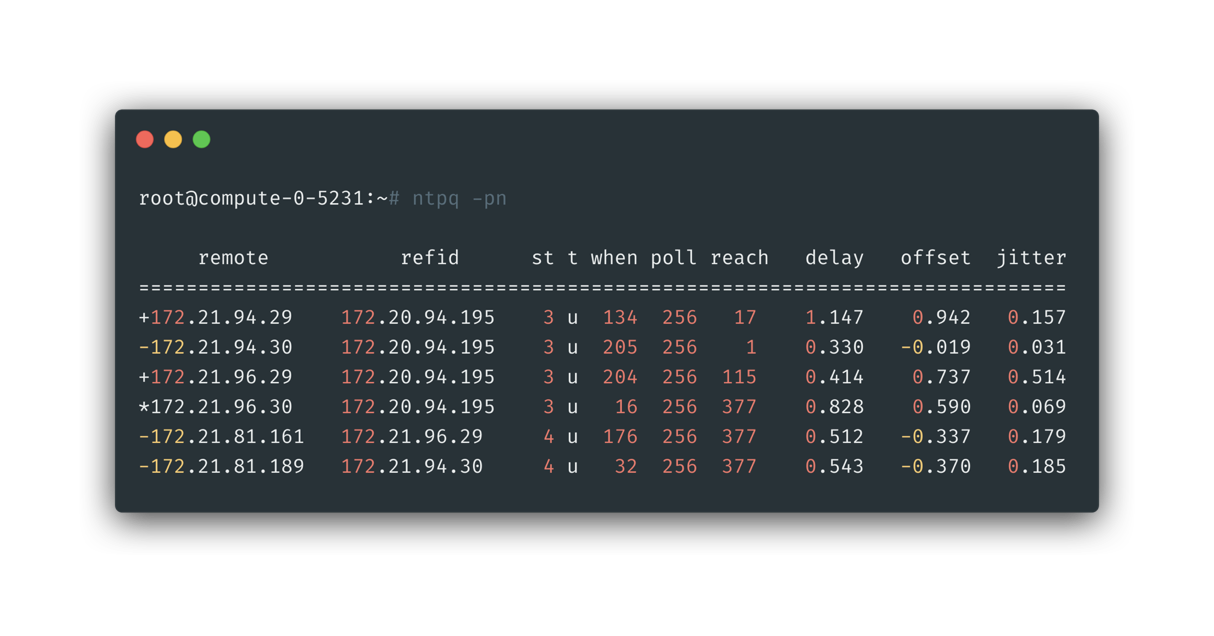
It’s a good sign to know this issue was actually easier to have the minimum reproduction: just query it directly from cpn hypervisor node, and, it’s in high frequency(easy to repoduce).
Then we have below questions:
- What made our NTP call different from other systems(to possibly cause this issue)?
- Why it’s not happening not for always? And related to reboot?
With above questions, I looked into the above blue circle between cpn hypervisor node and external NTP. The external NTP server is only reachable from OaM Network, under the hood cpn hypervisor node actually reached external NTP-A via a vRouter running inside cpn. That is, the last path of above blue circle is actually this orange circle below, aka, not from cpn hypervisor node itself.
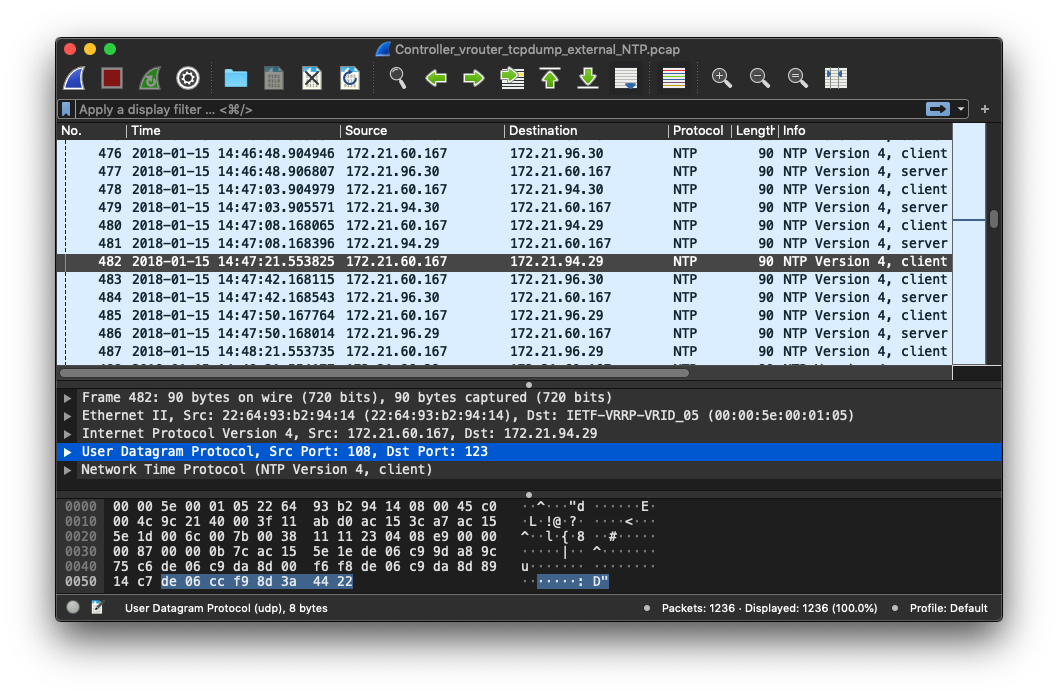
With above knowledge, packet from its cpn vRouter was captured:
By checking the packet with no.482, whose client NTP call was not responded(others around it got responded), something intresting was found:
- The Source Port of this packet is not the well-known
123port, instead, it’s108. - For those got resonped in this cluster, they are in source port
123.
This was something close to the turth, still more questions to answer😀:
- Was other cluster(without issues) in samliar situation?
src.port==108?- Yes and No, I checked on other Openstack Cluster, all other clusters had one
non-123 portbeing used when reaching NTP servers, while only this cluster encounted issues.- Should client source port be the well-known 123?
- No, it’s not mandatory in
non-symmetric modesreferring to rfc5905
- No, it’s not mandatory in
- Seemed like a dead end!
- Should client source port be the well-known 123?
- Yes and No, I checked on other Openstack Cluster, all other clusters had one
- Why was source port being modified?
- The vRouter used masquerade NAT, if at the same time(close enough) more than one NTP requests from different cpn hypervisor nodes were sent to same remote NTP, inside vRouter it would trigger source ports modification.
- The modification was randomly chosen and fixed in first time in memory.
- This also explained why it’s related to system reboot.
- The modification was randomly chosen and fixed in first time in memory.
- The vRouter used masquerade NAT, if at the same time(close enough) more than one NTP requests from different cpn hypervisor nodes were sent to same remote NTP, inside vRouter it would trigger source ports modification.
Now we know information on how and why source port was modified in the alarm-raising cluster, but still cannot figure out why only that cluster encountered issue. At that time I really didn’t have more ideas, but the difference seemed to be related to in the random source port it chosed. I guessed something could be wrong on handling non-123 src.port NTP requests, then I googled this with keyword like:
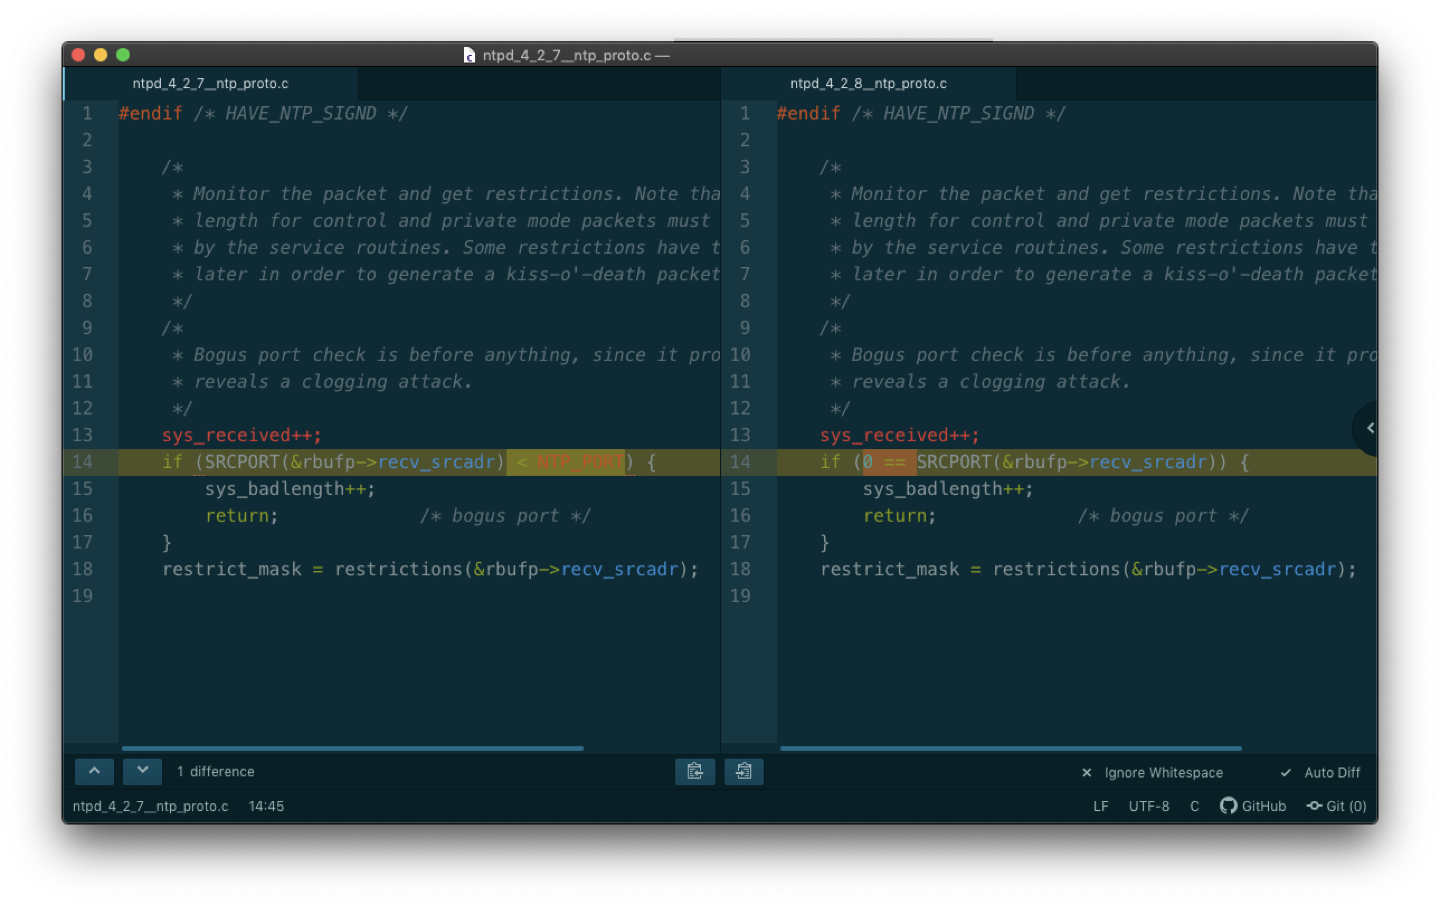
And yes, I got some clue here: https://bugzilla.redhat.com/show_bug.cgi?id=1171630.
From the bug page we could tell, in certain verison of ntpd (like 4.2.7) , there was a bug to drop ntp request with source port number below 123, and it was fixexd in 4.2.8:
TLDR;
Then I asked the NTP-A administorator to confirm the ntpd version, it was 4.2.7😜.
The solution will be: upgrade nptd from NTP-A.
also, we come to know that the NTP-B was too old to have this NTP bug in its ntpd.
Well, I am not a story-teller but, I really consider this troubleshoot case intresting, and it’s true as quoted from Jacob:
Distributed bugs are often latent.
Appendix
ntpq -pn explained
1 | $ man ntpq |
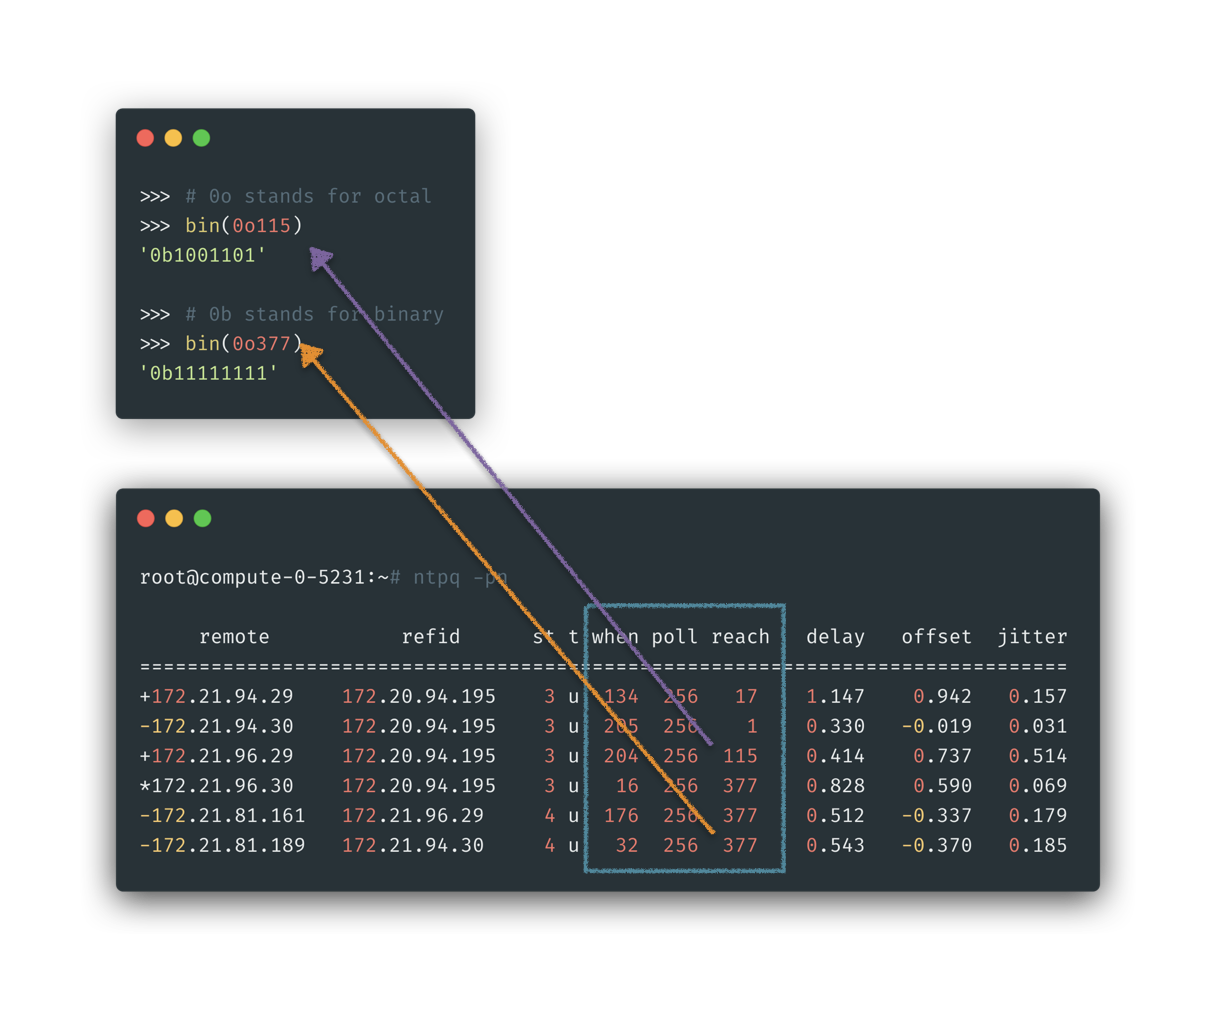
We could focus on three columns of when, poll, reach as explained in above manual and below square. It told us:
- The stats will poll remote NTP servers in interval: 256 s
- For remote server
172.21.96.29marked in purple arrow:- It received last packet since 204 seconds.
- And for last 8 times stats, 3 times of the service side respond were not recieved
- For remote server
172.21.81.189marked in purple arrow:- It received last packet since 32 seconds.
- And for last 8 times stats, 0 times of the service side respond were not recieved